VISUALIZATION AND ANALYTICS PLATFORM
VISUALIZATION PLATFORM
发布时间:2020-03-19 10:22:40| 浏览次数:1515


                                                 kappframework-zJexuT(1)(1).png


                                                                        Visualization Features in Precision Positioning and IoT Software Platforms

                                                                           Comprehensive 3D and 2D Visualizations

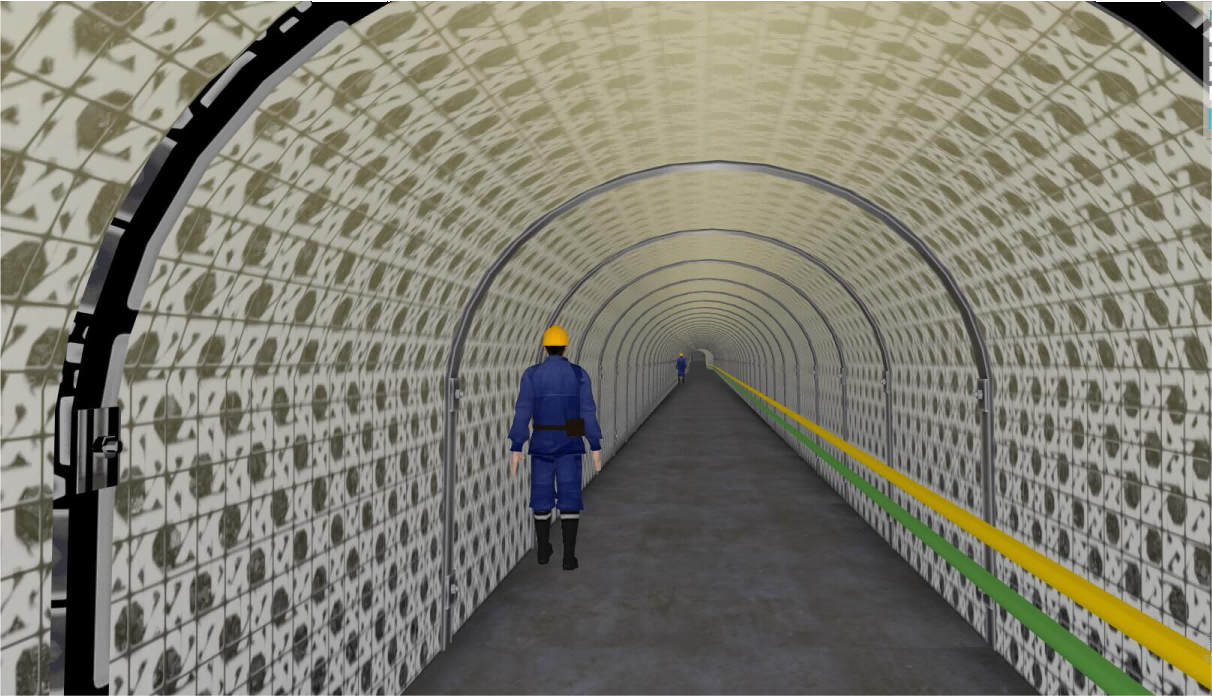
                                                                        1. 3D Maps: Provide immersive and detailed views of facilities, including multi-level structures and spatial relationships.

                                                                        2. 2D Overlays: Offer simplified, top-down visualizations for quick analysis and monitoring of locations and movements.

                                                                           Dynamic Visualization Methods

                                                                        1. Heatmaps to display activity density and identify high-traffic or high-risk areas.

                                                                        2. Trajectory paths for analyzing historical movement patterns and optimizing workflows.

                                                                        3. Real-time indicators showing live positioning and environmental data.

                                                                           Interactive and Customizable Views

                                                                        1. User-adjustable perspectives in 3D environments for focused exploration of specific areas or objects.

                                                                        2. Layered visualization to combine spatial data with operational metrics for comprehensive insights.

                                                                        3. Custom dashboards for personalized monitoring preferences and task-specific views.

                                                                           Data-Driven Alerts and Highlights

                                                                        1. Visually emphasize anomalies or critical events, such as unauthorized zone entries or equipment failures.

                                                                        2. Integrate geofenced areas with visual cues for enhanced safety and compliance monitoring.

                                                                           Integration of Visualization Tools

                                                                        1. Seamlessly combine data from multiple systems into unified visual representations.

                                                                        2. Adaptable for augmented reality (AR) or virtual reality (VR) integrations for advanced visualization needs.


Next:ANALYTICS PLATFORM